Blog
Finviz Explained: A Complete Guide to Stock Screening, Futures, and Market Analysis

In today’s fast-moving financial markets, having the right data at the right time can make all the difference. Traders and investors need tools that simplify complex market information and turn raw data into actionable insights. One such powerful platform is Finviz.
Finviz, short for Financial Visualizations, is widely used by traders, investors, and analysts to screen stocks, track futures, analyze market trends, and visualize financial data. Whether you are a beginner learning the basics or an experienced trader refining your strategy, Finviz offers tools that can significantly improve your decision-making.
This complete guide explains what Finviz is, how it works, and how to use its stock screening, futures data, and market analysis features effectively.
What Is Finviz?
Finviz is an online financial analysis platform designed to help users analyze stocks, futures, forex, and overall market performance using visual data and advanced filters. It aggregates information from multiple sources and presents it in a clean, easy-to-understand format.
The platform is best known for its:
- Powerful stock screener
- Interactive charts and heat maps
- Real-time futures and market data
- News aggregation and insider trading insights
Finviz is available in both free and paid (Finviz Elite) versions, making it accessible to a wide range of users.
Why Finviz Is Popular Among Traders and Investors
Finviz has gained popularity because it combines simplicity with depth. Unlike many complex trading platforms, Finviz does not require software installation and works directly in a web browser.
Key reasons traders use Finviz include:
- Fast stock filtering using dozens of criteria
- Visual representation of market trends
- All-in-one dashboard for stocks, futures, and news
- Time-saving analysis tools
Whether your goal is day trading, swing trading, or long-term investing, Finviz helps you spot opportunities quickly.
Understanding the Finviz Stock Screener
The Finviz stock screener is the platform’s most powerful feature. It allows users to filter thousands of stocks based on technical, fundamental, and descriptive criteria.
1. Descriptive Filters
These filters help narrow down stocks by general characteristics such as:
- Market capitalization
- Sector and industry
- Country and exchange
- Index inclusion
This is useful if you want to focus on specific markets, like U.S. tech stocks or small-cap companies.
2. Fundamental Filters
Fundamental analysis focuses on a company’s financial health. Finviz provides filters such as:
- Price-to-Earnings (P/E) ratio
- Earnings growth
- Revenue growth
- Dividend yield
- Debt-to-equity ratio
Long-term investors use these filters to find undervalued or fundamentally strong stocks.
3. Technical Filters
Technical traders rely heavily on price action and trends. Finviz offers filters like:
- Moving averages
- Relative Strength Index (RSI)
- Pattern recognition
- Support and resistance levels
- Volume and volatility
These filters are ideal for day traders and swing traders looking for momentum or breakout setups.
4. Using Presets and Custom Screens
Finviz provides built-in presets such as:
- Oversold stocks
- Top gainers
- New highs or lows
You can also save custom screeners, allowing you to reuse your strategy daily without rebuilding filters.

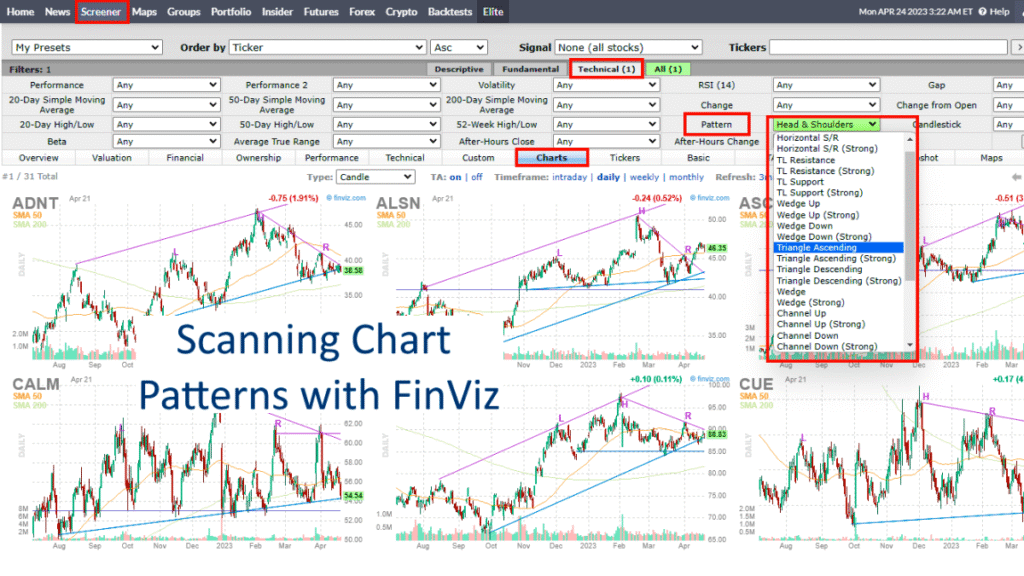
Finviz Charts and Visual Tools
Finviz stands out because of its visual approach to market data.
Interactive Stock Charts
Each stock has an interactive chart showing:
- Price movement
- Volume
- Technical indicators
- Pattern highlights
These charts help traders quickly identify trends without switching platforms.
Market Heat Maps
The heat map feature visually displays market performance by:
- Sector
- Industry
- Individual stocks
Green indicates gains, red indicates losses, and size represents market capitalization. This tool is excellent for spotting sector rotation and market sentiment at a glance.
Performance Maps
Performance maps show how stocks or sectors have performed over specific time frames, helping investors understand short-term and long-term trends.
Futures Data on Finviz
Finviz also provides valuable insights into futures markets, which are essential for understanding broader market direction.
Available Futures Markets
Finviz tracks major futures such as:
- S&P 500 futures
- Nasdaq futures
- Dow Jones futures
- Crude oil
- Gold and silver
- Agricultural commodities
This data is crucial for traders who want to anticipate market openings and global trends.
Why Futures Data Matters
Futures often move before stock markets open. By analyzing futures:
- Traders can predict market sentiment
- Investors can prepare for volatility
- Day traders can plan entries and exits
Finviz displays futures data in a simple format, making it accessible even for beginners.
Market News and Insider Trading Insights
Financial News Aggregation
Finviz pulls news from trusted financial sources and links headlines directly to relevant stocks. This allows users to:
- Stay updated on market-moving events
- React quickly to earnings or announcements
- Understand why a stock is moving
Insider Trading Data
One unique feature of Finviz is its insider trading section, which tracks:
- Insider buys and sells
- Transaction sizes
- Timing patterns
Finviz Free vs Finviz Elite
Free Version Features
The free version includes:
- Delayed quotes
- Basic stock screener
- Heat maps
- Market news
It’s perfect for beginners or casual investors.
Finviz Elite Features
Finviz Elite unlocks advanced tools such as:
- Real-time data
- Advanced charting
- Backtesting capabilities
- Exportable screening results
- No advertisements
Active traders often upgrade to Elite for speed, accuracy, and deeper analysis.
Who Should Use Finviz?
Finviz is suitable for a wide range of users:
- Beginners learning stock market basics
- Day traders looking for momentum stocks
- Swing traders identifying technical setups
- Long-term investors analyzing fundamentals
- Market analysts tracking overall trends
Its flexibility makes it a valuable tool regardless of trading style.
Pros and Cons of Finviz
Pros
- Easy-to-use interface
- Powerful stock screening
- Visual market analysis
- Free version available
- Covers stocks, futures, and news
Cons
- Limited backtesting in free version
- Not a trading execution platform
- Some data is delayed without Elite
Despite a few limitations, Finviz remains one of the most efficient market research tools available online.
Tips for Using Finviz Effectively
- Combine technical and fundamental filters for better results
- Use heat maps daily to track sector strength
- Save custom screeners for consistency
- Cross-check signals with other tools
- Avoid over-filtering, which can limit opportunities
With practice, Finviz can become a daily habit that improves your trading discipline.
Final Thoughts
Finviz is more than just a stock screener. It is a complete market analysis platform that brings together stock screening, futures data, charts, news, and visual insights in one place. Its intuitive design and powerful features make it suitable for both beginners and professionals.
If you want to save time, reduce noise, and make smarter market decisions, Finviz is a tool worth adding to your trading routine. Whether you use the free version or upgrade to Elite, the platform offers valuable insights that can help you stay ahead in today’s competitive financial markets.